
Estimated Time to Read: 15 minutes 🕒
Introduction
When it comes to assessing a company’s financial health, one of the key documents that analysts, investors, and stakeholders turn to is the income statement. But what exactly does this document reveal, and why is it so vital for anyone interested in a company’s performance?
The income statement, often referred to as the profit and loss statement (P&L), serves as a financial report card, offering a comprehensive view of a company’s revenues, expenses, and overall profitability over a set period—typically quarterly or annually. Unlike the balance sheet, which provides a snapshot of what a company owns and owes at a particular point in time, the income statement focuses on performance over time. This distinction is crucial because it reveals how effectively a company is generating profit from its operations.
For investors, understanding the income statement is not just about knowing how much money a company makes. It’s about diving into the details of revenue streams, cost management, and profit margins to assess the business’s sustainability and growth potential. Similarly, business owners use the income statement to evaluate their strategies, monitor expenses, and identify areas for improvement. Even if you’re a finance enthusiast seeking to deepen your knowledge, mastering the income statement is essential. It provides insights into key metrics such as gross profit, operating income, and net profit, which are critical for making informed investment decisions or business strategies.
Whether you are evaluating a potential stock investment, managing a business, or simply exploring the intricacies of financial analysis, the income statement is a powerful tool that lays the foundation for informed decision-making.
What is an Income Statement?
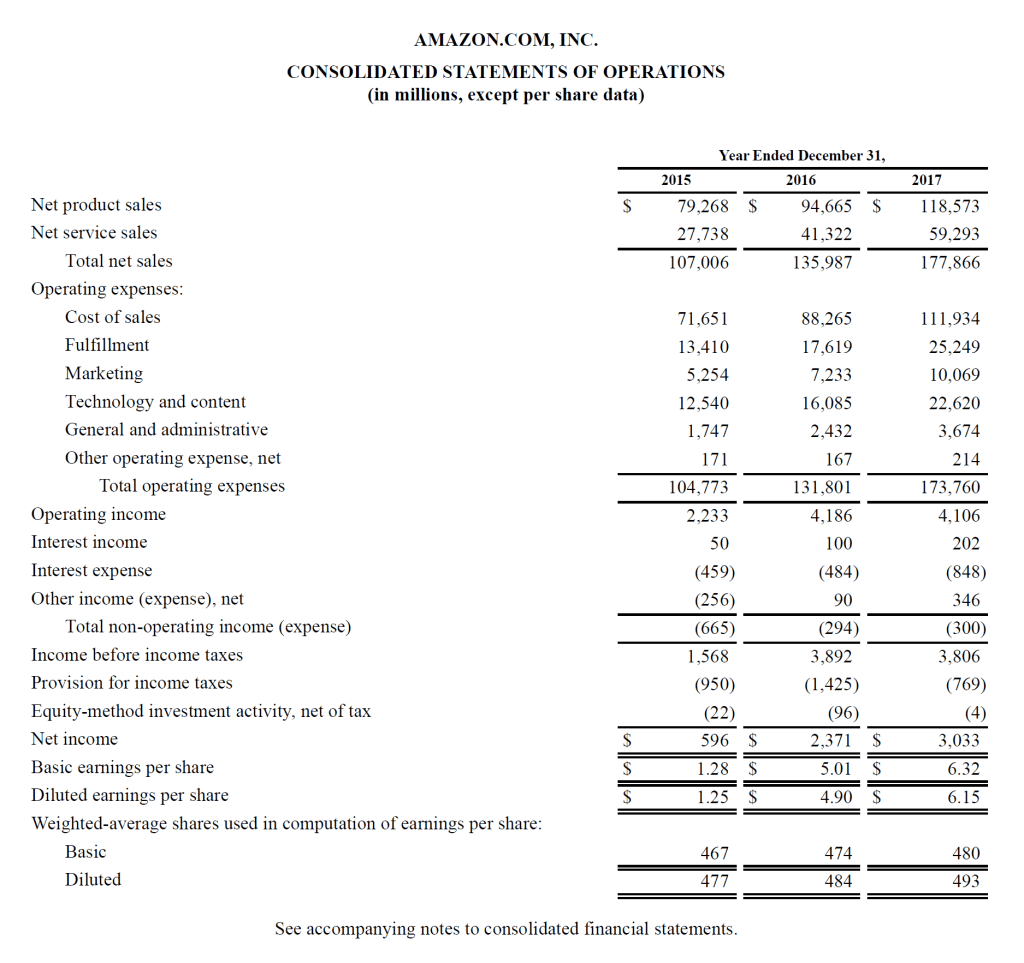
An income statement provides a detailed account of a company’s revenue, expenses, and overall profitability over a specified period, typically a quarter or a year. It’s one of the three main financial statements, alongside the balance sheet and cash flow statement, and serves as a crucial indicator of a company’s operational health.
However, an income statement is more than just a snapshot of profits and losses. It offers a granular look at how different aspects of the business are performing, highlighting where the company is excelling and where it might be encountering challenges. Understanding its nuances can give investors and analysts an edge in evaluating a company’s true financial position.
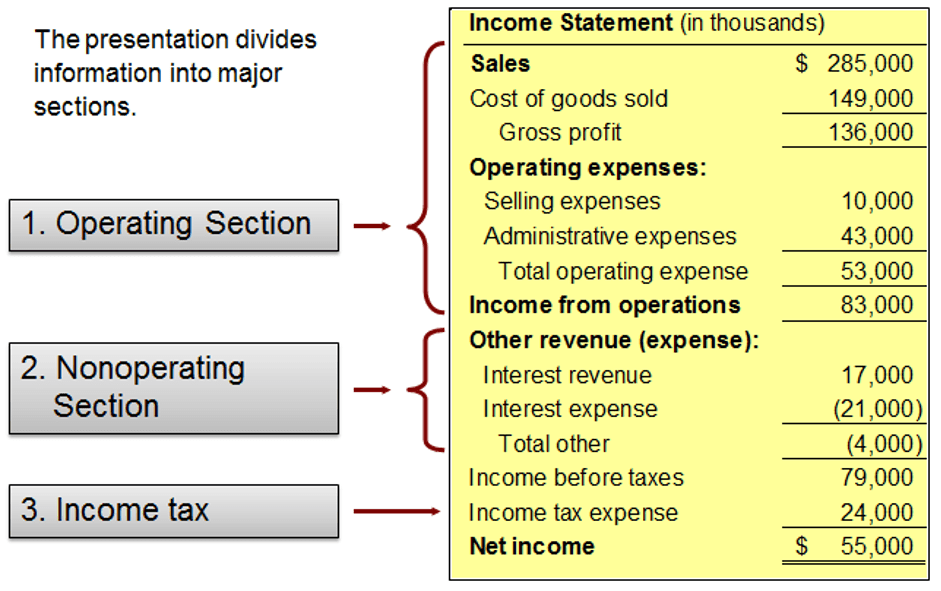
Breaking Down the Income Statement Structure
The income statement is typically divided into key sections that tell a comprehensive story about the company’s operational efficiency:
1. Revenue (Sales): The Top Line
Revenue is the starting point of the income statement and represents the total amount of money earned from a company’s primary business activities. It can be broken down further into different revenue streams, such as product sales, service fees, subscription income, and more. Here’s what to examine in detail:
- Growth Rate: Consistent revenue growth signals a company’s ability to expand its market share, introduce new products, or increase its pricing power. A fluctuating revenue growth rate may indicate underlying issues, such as market saturation, pricing pressures, or changes in consumer preferences.
- Revenue Quality: Look beyond the total revenue figure. Is it mostly derived from recurring sources (e.g., subscriptions, long-term contracts) or one-time sales? Recurring revenue is more stable and predictable, making it a positive indicator for future cash flows.
- Revenue Recognition: The accounting method used to recognize revenue can impact the reported figures. Companies might use different standards, such as recognizing revenue at the point of sale or spreading it over the contract’s life. Understanding the revenue recognition policy helps in comparing companies on a like-for-like basis.
2. Cost of Goods Sold (COGS): The Direct Costs
COGS includes all direct costs associated with producing goods or services sold by the company, such as raw materials, direct labor, and manufacturing overhead. Here’s how to dig deeper into COGS:
- Components of COGS: Breaking down COGS into its components—materials, labor, and overhead—can reveal which part of the production process is driving costs. For example, rising material costs may indicate issues with supply chain efficiency or commodity price volatility.
- Inventory Management: For companies that hold inventory, changes in COGS can be linked to inventory management practices. Using inventory valuation methods like First-In-First-Out (FIFO) or Last-In-First-Out (LIFO) can affect the reported COGS, particularly in times of fluctuating prices.
- Gross Profit Sensitivity: A small increase in COGS can significantly affect the gross profit margin. For example, companies operating in highly competitive markets may experience price wars, which can erode gross profit margins. Investors often monitor COGS trends to assess a company’s pricing strategy and production efficiency.
3. Gross Profit: Core Profitability
Gross profit is the difference between revenue and COGS, reflecting how efficiently a company can produce its goods or services. It forms the basis for covering other operating expenses and investments. Key aspects to consider:
- Gross Profit Margin: Calculated as (Gross Profit / Revenue) x 100, this ratio indicates the proportion of revenue that exceeds the direct costs of production. A high gross profit margin suggests strong product pricing power and efficient production processes.
- Industry Benchmarks: Comparing a company’s gross profit margin against industry averages can reveal its competitive position. For example, a tech company with a 70% gross margin is typically more efficient than a manufacturing company where margins may hover around 30-40%.
4. Operating Expenses: Running the Business
Operating expenses include the costs incurred to keep the business running, such as:
- Selling, General, and Administrative (SG&A): This covers salaries, marketing, rent, utilities, and administrative costs. Investors often scrutinize SG&A as a percentage of revenue to understand how efficiently the company scales its operations. A high SG&A ratio might indicate excessive spending on marketing or inefficient administrative processes.
- Research and Development (R&D): Especially relevant for tech and pharmaceutical companies, R&D expenses can significantly impact a company’s future growth prospects. High R&D spending may result in short-term profitability sacrifices but could lead to innovative products and long-term gains.
- Depreciation and Amortization: These non-cash expenses represent the allocation of the cost of long-term assets over time. While they do not directly affect cash flow, changes in depreciation methods or asset values can impact operating income.
5. Operating Income (EBIT): Core Profitability Assessment
Operating income, or Earnings Before Interest and Taxes (EBIT), is derived by subtracting operating expenses from gross profit. It represents the company’s profitability from its core operations without considering financial and tax impacts.
- Operating Margin: Calculated as (Operating Income / Revenue) x 100, this ratio indicates how efficiently a company manages its operating expenses relative to revenue. A higher operating margin means that the company is better at converting revenue into operating profit.
- Trend Analysis: Investors often track the trend in operating margin over multiple periods. An improving margin may signal that the company is successfully scaling its business, while a declining margin could indicate rising costs or pricing pressures.
- Earnings Quality: Since EBIT excludes interest and taxes, it provides a clearer view of operational performance. However, investors should be cautious of companies that exclude recurring expenses from their operating income calculations, such as stock-based compensation or restructuring charges.
6. Net Income: The Bottom Line
Net income is the final profit figure after subtracting all expenses, including interest, taxes, and one-time items. This is often referred to as “the bottom line” and is a key measure of a company’s overall profitability.
- Non-Operating Items: Understanding non-operating gains or losses, such as interest income, gains from asset sales, or foreign exchange fluctuations, is essential. While they impact net income, they do not reflect the company’s core operational performance.
- One-Time Charges: Companies sometimes incur one-off expenses, like litigation costs or asset impairments. While these can distort net income for the period, analyzing them separately can provide insights into management’s decision-making and the company’s financial health.
- Tax Strategies: Effective tax management can significantly impact net income. Some companies use tax strategies to reduce their effective tax rate, which might not be sustainable in the long term. Understanding the components of tax expenses can shed light on the company’s future profit potential.
Advanced Considerations for Investors
- Earnings Before Interest, Taxes, Depreciation, and Amortization (EBITDA): Some investors prefer to look at EBITDA instead of EBIT, as it excludes non-cash depreciation and amortization expenses. EBITDA provides a view of operational cash flow, which can be particularly useful for companies with significant capital investments.
- Operating Leverage: A company with high fixed costs relative to variable costs has high operating leverage. During periods of revenue growth, high operating leverage can amplify profits. Conversely, during downturns, it can magnify losses, making it crucial for investors to understand a company’s cost structure.
By diving into each of these sections, investors can uncover insights into how a company generates its profits, manages costs, and positions itself within its industry. A comprehensive analysis of the income statement enables a deeper understanding of a company’s business model, competitive advantages, and future profitability potential.
Why the Income Statement is Crucial for Investors
For investors, the income statement is not just a financial report—it’s a roadmap that reveals a company’s journey through revenue generation, cost management, and profitability. It provides a comprehensive view of how a company operates, its efficiency in managing resources, and its potential for future growth. By dissecting various elements of the income statement, investors can gain insights into the company’s financial health and its strategic direction. Here’s why this document is so critical:
1. Revenue Stability and Growth
Revenue, often referred to as the “top line,” is the lifeblood of any business. For investors, stable and steadily growing revenue is a strong indicator of market demand and effective business strategies. However, it’s not just about the absolute revenue numbers:
- Consistency: Investors look for revenue that grows consistently over time. A sudden spike or drop in revenue can signal significant changes in the market or the company’s operations. A detailed analysis can reveal if the surge is due to a one-off event (e.g., a large contract or asset sale) or a sustainable shift in strategy, such as market expansion or new product lines.
- Revenue Quality: Understanding the sources of revenue is equally important. Is the revenue derived from a diversified portfolio of products or services, or is it concentrated in a single area? A company with multiple revenue streams is often better positioned to withstand market fluctuations.
- Recurring vs. One-Time Revenue: Investors prefer companies with recurring revenue models (e.g., subscriptions, maintenance services) because they offer predictability and stability. One-time sales, while boosting short-term revenue, may not indicate long-term financial health.
2. Profit Margins: A Window into Operational Efficiency
Profit margins give investors a deep dive into a company’s ability to manage its costs relative to its revenue. Each margin—gross, operating, and net—tells a different part of the story:
- Gross Margin: This measures how efficiently a company produces its goods or services. A high gross margin indicates that the company has strong pricing power and control over production costs. Comparing this margin to industry peers can highlight a competitive advantage or areas needing improvement.
- Operating Margin: This reflects the company’s ability to manage its operating expenses, including salaries, rent, and marketing. An improving operating margin over time suggests that the company is scaling efficiently or successfully cutting unnecessary costs.
- Net Profit Margin: The final layer, net profit margin, shows how much of each dollar earned is translated into profit. It includes all operating and non-operating expenses, taxes, and one-time charges, giving investors the full picture of a company’s financial performance. A shrinking net profit margin may signal rising interest costs, increased tax burdens, or other financial challenges.
3. Trend Analysis: Uncovering the Bigger Picture
Investors often examine trends in revenue growth and profit margins over several periods. Consistent improvements suggest that the company is becoming more efficient and competitive, while deteriorating trends may raise red flags about potential operational or strategic issues. For instance:
- Revenue Growth vs. Profitability: Rapid revenue growth without a corresponding increase in profit margins can indicate that the company is sacrificing profitability to capture market share. While this may be part of a strategic growth plan, it’s essential to assess whether it’s sustainable in the long term.
- Cost Structure Analysis: Changes in COGS or operating expenses relative to revenue can signal shifts in the company’s cost structure. For example, if operating expenses are growing faster than revenue, it could indicate inefficiencies or the need for further investments to sustain growth.
4. Operational Performance and Risk Assessment
Beyond profitability, the income statement reveals how well a company is managing its core operations. High operating margins indicate that a company is efficiently controlling its costs, which can provide a buffer during economic downturns or market competition. Conversely, narrow margins may highlight a vulnerability to rising costs or revenue fluctuations.
5. Forecasting and Valuation
The income statement serves as a basis for financial modeling, valuation, and forecasting future performance. Key metrics like Earnings Per Share (EPS) and net income growth rates are fundamental in calculating valuation ratios such as the Price-to-Earnings (P/E) ratio. Investors use these metrics to assess whether a stock is overvalued or undervalued compared to its earnings potential.
6. Uncovering Red Flags and Earnings Quality
The income statement also helps investors spot potential red flags:
- One-Time Charges: Investors need to identify one-time expenses, such as litigation costs or restructuring charges. While these can temporarily affect net income, they may not reflect the company’s ongoing profitability. However, frequent “one-time” charges could indicate deeper issues with management or business operations.
- Revenue Recognition Practices: Companies sometimes use aggressive revenue recognition practices to inflate short-term earnings. Investors should be cautious if they observe significant revenue growth without a corresponding increase in cash flow, as it may suggest accounting adjustments or non-cash transactions.
- Expense Management: A sudden increase in operating expenses, particularly SG&A or R&D costs, may indicate a shift in strategy. While investments in marketing or R&D can fuel growth, persistent overspending may lead to declining profitability.
By carefully analyzing these aspects of the income statement, investors gain a holistic view of a company’s financial performance, operational efficiency, and potential risks, allowing them to make more informed investment decisions.
Key Metrics and Ratios to Focus On
1. Revenue Growth:
Revenue growth is not just about increasing sales; it indicates a company’s ability to expand its market presence and competitiveness. While a rising revenue line is a good sign, understanding how that growth is achieved is crucial. Is it driven by an increase in sales volume, price hikes, or a new product launch? A company growing revenue primarily through higher prices might indicate strong brand positioning or market control. Conversely, growth driven by volume can suggest effective market penetration and demand. Investors should watch for sustainable growth—a surge in revenue due to one-off events or short-term promotions can be misleading.
2. Gross Margin:
Gross margin is calculated as (Gross Profit / Revenue) x 100, revealing how efficiently a company produces its goods or services. It’s a key indicator of production efficiency and pricing strategy. A declining gross margin may signal rising production costs, supply chain issues, or pricing pressure from competitors. In contrast, a stable or improving gross margin indicates effective cost management and the ability to maintain or enhance pricing power. For industries with high production costs, a slight change in gross margin can significantly affect profitability. Investors often compare a company’s gross margin to industry benchmarks to assess its competitive standing.
3. Operating Margin:
Operating margin, derived from (Operating Income / Revenue) x 100, measures how well a company controls its operating expenses, including costs like salaries, marketing, and R&D. High operating margins reflect strong operational efficiency, giving the company more flexibility to reinvest in growth initiatives, pay dividends, or navigate economic downturns. For example, a tech company with a high operating margin can more comfortably invest in R&D, which is crucial for innovation. Investors should analyze operating margin trends—an increasing margin suggests improving efficiency, while a declining margin could indicate rising costs or operational challenges.
4. Net Profit Margin:
Net profit margin is the percentage of profit a company makes for every dollar of revenue after accounting for all costs, including operating expenses, taxes, and interest. This metric offers a comprehensive view of a company’s overall profitability and financial health. Investors compare net profit margins across industry peers to identify the most efficient operators. A higher net profit margin suggests effective cost management and pricing strategies, while a lower margin may highlight vulnerabilities, such as high debt servicing costs or excessive tax burdens.
5. Earnings Per Share (EPS):
EPS allocates net income to each outstanding share, offering insight into a company’s profitability on a per-share basis. A consistently growing EPS is generally a positive sign, indicating that the company is generating increasing profits for shareholders. However, investors should be cautious of artificial boosts to EPS, such as share buybacks, which reduce the number of outstanding shares and inflate the EPS without necessarily reflecting improved operational performance. When evaluating EPS, consider the underlying reasons for its growth—are they driven by genuine profit increases, or merely by financial maneuvers?
Real-World Example: How Investors Use the Income Statement
Consider an investor examining a tech company that displays soaring revenues but shows a decline in operating margins. This scenario could initially raise concerns, but a deep dive into the income statement might reveal important details. Suppose the company has significantly ramped up its R&D and marketing expenses, which are driving the increase in costs. On the surface, this seems like a hit to profitability. However, it’s essential to analyze why these expenses have risen.
If the increase in R&D spending is funding innovative product development that is capturing new market segments or enhancing the company’s competitive edge, this could be a sign of a strategic investment rather than a financial red flag. Similarly, higher marketing expenses might indicate efforts to solidify brand presence or expand into new markets, laying the groundwork for long-term revenue growth. This perspective helps the investor understand that while short-term profitability might take a hit, these actions could lead to substantial future gains.
In contrast, if the income statement reveals that these increased expenses are not translating into new product releases, market expansion, or significant sales growth, it might indicate inefficient operations or mismanagement. For instance, if R&D expenses rise but no new products are launched, or if marketing spending surges without a corresponding increase in sales, the company might be struggling with ineffective allocation of resources.
Investors utilize this nuanced analysis to assess whether the company’s current spending is strategically positioning it for future success or serving as a warning sign of operational inefficiency. By understanding how each line item in the income statement ties back to the company’s broader strategy and market positioning, investors can make more informed decisions about the company’s long-term viability and growth potential.
Potential Risks and Challenges in Using the Income Statement
While the income statement is a valuable tool, it has limitations that investors should be aware of:
- One-Time Charges: Items like asset write-downs or legal settlements can distort net income, making it appear artificially low or high. Investors should identify these non-recurring charges to understand the company’s underlying operational performance.
- Revenue Recognition Issues: Companies may sometimes recognize revenue early to inflate their earnings, a tactic that can mislead investors about a company’s true financial health. It’s crucial to understand the company’s revenue recognition policies, especially in industries with complex revenue streams like software or construction.
- Accounting Policies: Changes in accounting methods, such as how inventory or depreciation is calculated, can impact reported profits. Investors need to look beyond the surface numbers to understand how these accounting choices might be influencing the financial results.
- Seasonality: For some businesses, revenues and profits can fluctuate seasonally. Retailers, for instance, often generate a large portion of their revenue during holiday seasons. Recognizing these patterns is essential to avoid misinterpreting quarterly income statements.
By understanding these nuances and potential pitfalls, investors can better interpret the income statement, leading to more informed investment decisions and an enhanced ability to identify undervalued or overvalued companies.ent decisions and avoid overvaluing or undervaluing a company.
References
- Investopedia: Income Statement: How to Read and Use It
- The Motley Fool: Income Statement: How to Read, Key Metrics
- Book: “Financial Statements: A Step-by-Step Guide to Understanding and Creating Financial Reports” by Thomas R. Ittelson
Conclusion
“To make our community even richer and more interactive, I invite you to participate actively! 🙌
Share the posts you find interesting, express your reactions, and don’t hesitate to leave a comment. Each of your actions helps spread financial knowledge to a wider audience. 📢💬
I am particularly interested in knowing your point of view: comment with your feedback, suggestions, or topics you would like to delve into. Your opinion is valuable for improving the content and offering insights more in line with your needs. 🔄🔍
Together, we can build a community where finance is accessible to everyone. Thank you for your support! 💖
Disclaimer 📜
Please note: The content shared across the channels reflects personal opinions and experiences. It is not intended as financial advice or an endorsement of specific strategies or products. 🚫
This information serves educational purposes only and should not be taken as professional financial guidance. Before making any financial decisions, we strongly recommend consulting with a qualified financial advisor. 📊➡️👨💼”
Keywords
#IncomeStatement #FinancialAnalysis #ProfitAndLoss #InvestmentTips #FinancialPlanning #RevenueGrowth #OperatingIncome #NetIncome #InvestingBasics #CFA #FinancialEducation #InvestmentStrategy
